

On Celtic By Numbers, taking advantage of the International break, I have been taking a checkpoint and assessing squad performance. 11 matches in, there is sufficient data to assess how the team is shaping up. Following articles on the Goalkeeping and Defending, we turn to the art of creation. Again, this is an opportunity to share in more detail the many different data points I collect for every match. In the match analysis articles, I tend to focus on specific points of interest and use the data that supports this. Hopefully, therefore, this will provide insight into the wider data set.
As before, a warning: few players (1 – Gordon) have played every minute, and therefore the sample sizes are still small leading to anomalies. For example, Kouassi has only played 36 minutes, Dembele 111.
Unless specified, the values are expressed as average instances per 90 minutes. This is a way of normalising the data to allow fair comparison where players have appeared for different amounts of time.
Possession Effectiveness Index (PEI)
This is a straightforward but useful measure of overall possession effectiveness. Basically, the higher the number, the more often the player maintains possession from his on-field actions. Passing heavily influences this index because passing actions account for over 75% of all on-field actions. But it includes all their other possession events.
High is not always “good” nor low “bad.” Centre backs should have high numbers (lots of low risk passing; under little pressure when passing). Strikers will tend to have lower numbers (they have less of the ball; they are trying to pass under pressure; they should be trying higher risk passes in the final 3rd of the pitch).
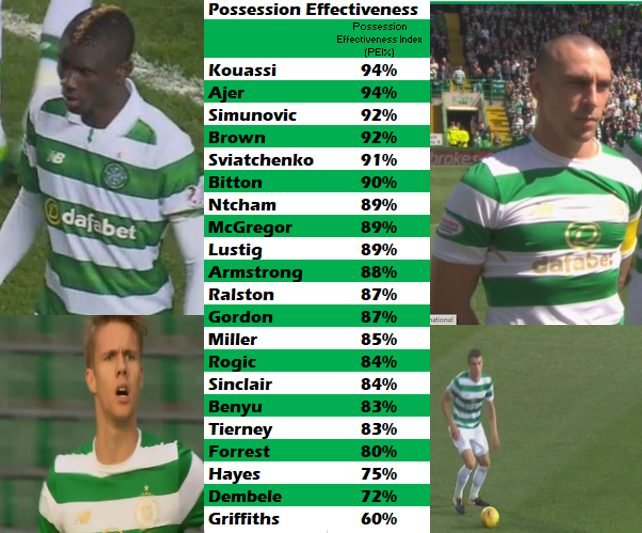
Kouassi has only played 36 minutes so let’s not get carried away!
Otherwise, the central defenders and more defensive midfielders are at the top. This is as it should be as they should not be playing high risk passes nor conceding possession too many times given they a) play centrally and b) are the last lines of defence.
McGregor at 89% is a stand out as he is usually an attacking player, but tends to play short and accurate passes. Armstrong is only 1% behind though, and last season his PEI was only 80%.
The full backs and attacking midfielders will tend to have lower numbers as, especially at Celtic, they spend a lot of time attacking. Therefore, potentially losing tackles, playing in traffic where there is heavy opponent engagement.
The risk takers tend to be at the bottom and the strikers. Forrest’s index score is surprisingly low given he is a careful player who takes fewer risks than the other wingers. Griffiths will always be bottom, and by a distance. Passing is something that gets in the way of shooting or him!
Passing
Passing is a major component of PEI but if we strip all other possession events out and focus just on passing, what do we get? Now Celtic pass the ball A LOT. This season Celtic average 662 completed passes per match. Under Deila it was 464.
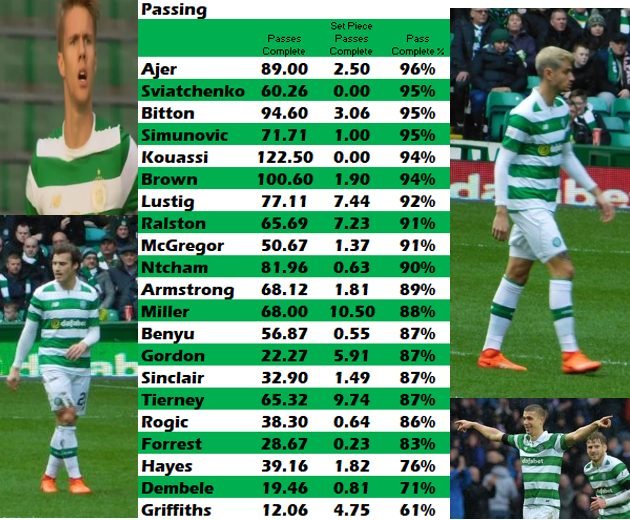
The first column is completed passes per 90 minutes from open play. The second column is the number of set piece passes completed per 90m. For the full backs, this will include throw ins. For Griffiths and Armstrong as examples, this will include corners. Finally, the 3rd column is percentage of all passes completed.
 You will notice the disparity depending on player position. The centre backs and central midfielders will tend to have the ball the most and complete the most passes. Brown is averaging over 100 passes per match. Last season he averaged 73.4. You are seeing Rodger’s strategy writ large, in numbers. Brown was Celtic’s most prevalent passes last season, and this season Lustig is passing more times that Brown did last.
The danger with high pass volume and high pass completion stats are that there is huge possession but little progression. I came across the term “Horseshoe of Futility” to describe Celtic against Linfield away. When the ball is endlessly recycled from side to side and through the central midfielders and defenders, you rack up seemingly impressive possession and passing stats, but don’t create any chances!
Which is why players like Armstrong and Ntcham are important, as we will see.
Interesting the much greater passing contribution from Hayes (39) compared to Forrest (29). Even Sinclair’s involvement is up! Sinclair tends to drift out of games for long periods and last season was completing just 27 passes per 90m.
And there is something oddly noble about Griffiths, who considers passing somehow a vulgar pursuit – much like the early football pioneers from Scotland who preferred to run with the ball! 12 open play passes per 90m smacks of “do I have to?”. I hope he is not being paid piece rate! Still, his productivity?

Assists and Expected Assists (xA)
That was the starter, and here, finally (!) are the prime cuts of creative analysis – what are you actually creating?
An assist is awarded to the player passing the ball to the scorer. There are other scenarios (e.g. being taken down from a scored free kick or penalty; having a shot saved but the rebound scored; providing the pass from which an own goal is scored – happened 3 times this season!).
xA is Expected Assists. This recognises the creator of the chance irrespective of the outcome. An example:
- Rogic passes to Griffiths
- Griffiths hits a shot from outside the box just over the bar
- Rogic gets approximately 0.03 xA since it was not his fault Griffiths missed the target – he created the chance. The value of 0.03 reflects that in general, only 3% of shots outside the box will result in goals.
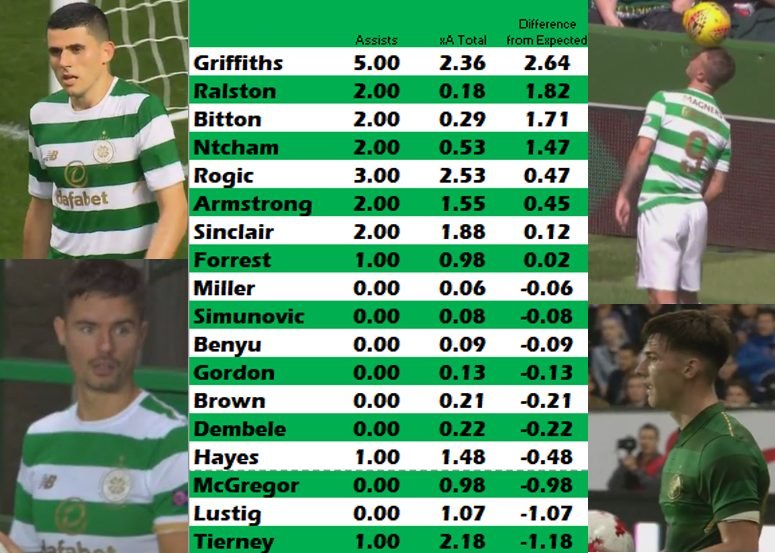
This shows Actual Assists compared to the total xA the player could expect given the chance they created.
The order of the data is not the most important aspect here so allow me to provide some highlights.
But first, let me explain the 3rd column. This is the difference between actual Assists awarded, and xA based on chances created. The difference is in some respects how lucky you are regarding whether the recipient of your pass finished the chance or not. But, being less facile, it can also reflect the quality of the pass/chance created.
Griffiths has racked up 5 assists so far. Analysing the shots that result from the passes he has provided; the Expected Goal (xG) model predicts 2.36 goals would have resulted. Therefore, he has outperformed that model by 2.64. That is, 2.64 more goals resulted than could have been expected, on average. It’s a small sample and could be a result of several factors (great finishing, poor defending, perfect pass). Over time, this should regress to the man – i.e. the xA and actual assists will become closer in value.
At the other end of the table are players that may be considered a little unlucky. For example, Tierney has 1 assist but based on the xG model his passes should have resulted in 2.18 goals. Tierney has the 3rd highest xA in the squad.
Neither McGregor nor Lustig have registered an assist yet, but both have been providing chances as we will see. Hayes has also suffered in this regard, unfortunate for a new player keen to make an impression. It is not for want of trying.
In the middle, we have Rogic who has registered 3 assists, with an xA of 2.53, roughly in line with how we’d expect him to perform given the chances he has created.
Chances Created
A chance created is any pass resulting in a shot at goal. Very simple.
The following shows the number of chances created per 90m.
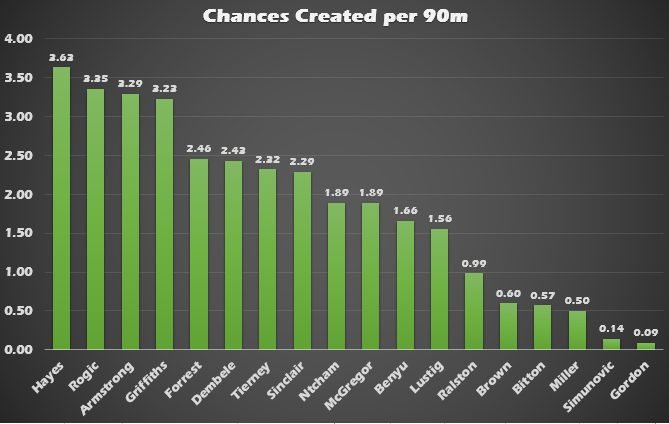
A clear leader is none other than Hayes. Despite creating the equivalent of 3.62 chances per 90m, he only has 1 assist. Last season Hayes recorded 24 assists for Aberdeen and, playing (with respect) with better players and in a side attacking more often, it is surely a matter of time before his assist rate is on the rise at Celtic.
No surprise to see Rogic, Armstrong and Griffiths next. Griffiths was only behind Roberts on chances created last season. Interesting to note the comparison between Armstrong and Ntcham. As I have shown on other articles, they operate in different parts of the field, with Ntcham rarely in the box.
McGregor can perhaps look to increase his chance creation rate although he tends to play safer passes than Rogic or Armstrong.
There is then a drop down to Forrest, who has a better chance creation rate than his form perhaps would predict.

Passing “Packing” and “Impect”
Stay with me! Respectfully, if you are new to this, please read my primer on Packing and Impect on my site – Concerning Packing. For transparency: this is new to me too, and I am refining how I capture the data. Long story short, expect the Impect scores and Packing rates to decrease over time as I am more critical than when I started judging whether a player has been “packed” or not. Essentially, rather than a simple “is the opponent now behind the ball” I am assessing whether the opposition defensive shape has been disrupted or not. If not, then the “pack” is meaningless.
Ok? So, this is a powerful way of rating every pass where the pass manages to take out at least one of the opposition. I’ll share all the pass pack data below, but here are the Impect leaders. This reflects the number of opponents by passed per 90m (defenders “packed” score higher than forwards for example, as bypassing a defender should get you quite close to goal).

I predicted before I started that Armstrong would be the Pack Man. Whereas my previous stats led me to think “he gives the ball away a lot”, seen through the lens of packing, we can see that Armstrong attempts high risk / high reward passes. Simply: his passes often break the defensive lines, removing opponents from the play. This is priceless against packed (any) defences Celtic see often. Which is why I’m so glad he stayed. That, and the scoring all the goals thing.
But, he now has a rival in Ntcham. As mentioned above they are different players and I discuss this in more detail in The Art of Olivier. It would be fruitful for them both to play together.
In third is the underrated Lustig. He tends to attempt longer passes from the back, and they are often effective. Remember his long pass to Dembele in the Scottish Cup semi-final last season that allowed Dembele to set up McGregor for the first goal?
Bitton and Brown are next mainly through sheer volume of passes they perform over the 90m.
The attacking midfielders and strikers will tend to score low as they receive the ball higher up the field with less scope to bypass a volume of opponents. It is not surprising Forrest is the lowest of the attacking midfielders. Both he and McGregor have scope for more creativity and risk in their passing.
Here are the full Packing and Impect passing data.

All values are per 90m averages. Except for the last column which shows what % of each players’ total passes take out at least one opponent. 25% of Armstrong’s passes “pack” at least one opponent. He averages 17.61 pack passes per 90m and by passes 48.87 opponents per 90m.
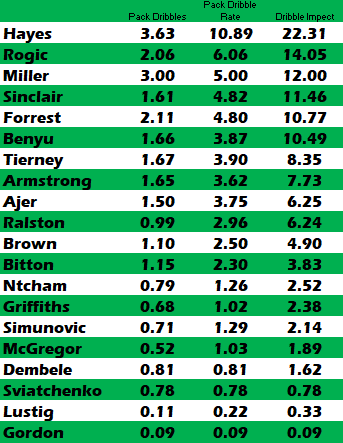
Dribble “Packing” and “Impect”
Same principle as pass packing but applied to dribbles or take-ons. Clearly, it is easier to bypass players by passing than by running past them as the ball can travel faster than any player. But it is a vital weapon to have to break down any team. So, whose dribbles have the most Impect?

Another metric by which Hayes shines. Despite lack of game time and lack of productive output, Hayes’s data shows promise. He appears to the naked eye to be the quickest player at the club, and this raw speed allows him to take out opponents.
Perhaps a surprise that Rogic is second. He is not the quickest and often receives the ball under heavy pressure. Yet he is a tall, powerful man and, as seen to thrilling effect in the Scottish Cup final, hard to stop when on the hoof.
The flying wingers are behind him, with Tierney closer to this peer group than other defenders. Note the difference between Armstrong and Ntcham again. Similarly, McGregor has a low dribble Impect score – reflective of his simpler passing game. He can carry the ball quickly over distance when there is an open field but tends not to take opponents on.
Even Gordon has dribbled past opponents – you may have been behind the settee when that happened.
Here is the complete Dribble data:
Expect that the next time I checkpoint squad performances, a certain Number 7 will appear near the top of most of these categories.
I have gone into more technical detail on the metrics and their meaning that I would normally do as I have exposed more of the data I collect than I normally do. Therefore, there has been more exposition required.
I hope you enjoy this type of data led analysis. If you prefer more bite sized data snacks, please follow me on Twitter celticbynumbers @Alan_Morrison67 and bookmark my site Celtic By Numbers.


I hope. Celtic. Can. Get. Back. To. Wining ways. At Douglas. Park and. Give. Them a lift. For the. Big game. On. Tuesday. Cochice Hail Hail ?? ?? ?? ??